By Steven Blair, Synaptec, Kevin Kawal and Qiteng Hong, University of Strathclyde, UK, and Panagiotis Papadopoulos, University of Manchester, UK
Background and need for synchronized waveform measurements: The definition of a synchrophasor assumes a sinusoidal waveshape, which is an approximation driven by the widespread use of rotating machines to generate power. Grids are moving to include significant converter-interfaced generation and HVDC links to displace conventional rotating machines and AC interconnections. Voltage and current waveforms may contain dynamic transients such as arcing, a fault with a time-varying DC component, phase steps, harmonics, and other forms of distortion which are not fully represented by phasors. The IEEE C37.118.1 synchrophasor measurement standard also requires a tight bandpass filter around the fundamental frequency (50 Hz or 60 Hz) which limits the bandwidth of information which can be extracted from synchrophasors, compared to time-domain samples. Therefore, synchrophasor data does not provide the detailed waveform, harmonic, and frequency dynamic range required to fully detect and analyze all phenomena and events in power systems.
Synchronized waveform-based monitoring, which is sometimes referred to as “sync-wave”, “point on wave” (POW), or “continuous point on wave” (CPOW) monitoring, will be increasingly important for meeting the needs of power system monitoring, protection, and control. Waveform data complements phasor measurement units (PMUs) and conventional SCADA measurements by enabling new applications. At present, digital waveform samples are typically used in the following scenarios:
- Internally within protection relays, power quality meters, fault recorders, and PMUs
- Across local area networks for IEC 61850-enabled protection systems with process bus
- For post-event analysis of faults and major system events
As with synchrophasors, accurate time synchronization is important for ensuring that waveform data from multiple locations can be compared.
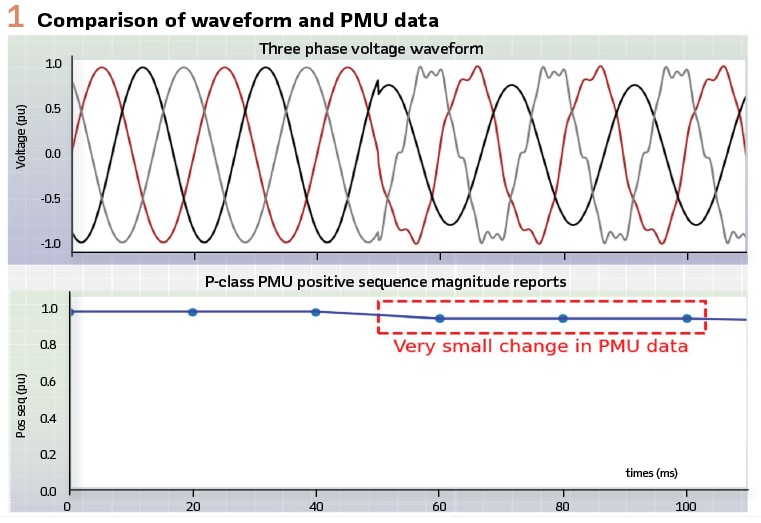
Figure 1 illustrates the value of waveform data compared to PMU data sources. The plots represent the positive sequence voltage magnitude from a P-class PMU (lower plot) derived from the underlying waveform data (upper plot) for the same simulated event. Clearly waveform data provides richer information about the system behavior, including harmonics and fast-acting transients.
This article will highlight some of the new applications which are enabled through monitoring, transferring, storing, and processing synchronized waveform data. It will cover practical aspects and relevant technical standards. This topic is also being actively advanced by the IEEE Task Force on Big Data Analytics for Synchro-Waveform Measurements (which recently produced the report PES TR-127) and CIGRE/IEEE Joint Working Group C4/C2.62/IEEE.
Applications
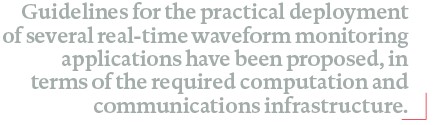
Transient event signatures:Power system transients typically occur at millisecond or microsecond timescales, which requires high sampling rates to capture the event. As an example, incipient faults are sub-cycle transients that can impact the condition of assets, such as accelerating gradual insulation degradation which eventually leads to permanent faults in underground cables (Figure 2). Transient signatures can be used to detect, characterize, and locate their occurrence. This can lead to improved strategies for monitoring asset health, to proactively find circuits which are prone to incipient faults before a permanent short-circuit fault occurs, avoiding damage, risk to life, loss of supply, and high cost to repair. The goal is to be able to find early warning signs of interesting or critical events, and use real-time detectors to deliver accurate, timely alarms to system operators.
Other interesting techniques have been developed, including:
- Classification of events, e.g., for root cause identification for electrical faults, by training from a relatively small history of labelled historical transients. This method can automatically interpret unseen disturbance waveforms, but without the usual need for a very large set of examples to train classifiers. Interestingly, this technique provides improved classification results at higher waveform sampling frequencies (76% and 94% accuracy, at 960 Hz and 3840 Hz, respectively)
- Location of transients such as incipient faults in complex distribution networks, using waveform monitoring at sparse locations, combined with analysis and modelling of the frequency components of these short-duration transients. Increasing the numbers of deployed monitoring locations can improve the granularity of the results
- Combined frequency- and time-domain features within waveform data to identify and classify events using image-based analysis techniques
- Capacitor switching, involving monitoring for oscillatory transients which can lead to restrikes during capacitor de-energization, due to faulty switch contacts
- Monitoring the per-phase operation time of circuit breakers. For example, one phase operating 1-2 cycles later than the other phases may indicate degradation which requires maintenance
Harmonics and power quality: Power quality metrics such as harmonics, interharmonics, and total harmonic distortion (THD) can also be computed from waveform data, which is not possible with synchrophasor data based only on the fundamental component.
For example, Dominion Energy found that solar photovoltaic (PV) integration caused widespread interharmonics to be observed. Initially, this was characterized as an interharmonic at 8 Hz, through analysis of wide-area synchrophasor measurements. However, later investigation with synchronized waveform data revealed that the true frequency was 22 Hz. This mismatch was due to decimation of the synchrophasor data without proper filtering, resulting in frequency aliasing. It illustrates how accurate real-time monitoring of metrics such as interharmonics and THD, on a per-cycle basics, at multiple locations, can help to reveal the sources of grid disturbances and mitigation strategies.
Power electronic devices, with relatively high switching frequencies, are therefore a key driver for waveform monitoring with harmonic analysis as they can inject harmonics and interharmonics into the grid. Such devices can also be seriously affected by poor power quality. For example, the Blue Cut fire incident in the USA in 2016 was exacerbated by the response of power electronics during phase step, low voltage, and high-harmonic conditions, resulting from many short-duration faults on HV lines.
Oscillation detection: Electromechanical oscillations which are driven by synchronous generator dynamics have been successfully monitored by PMUs. However, emerging converter-driven dynamics, which are influenced by proprietary control design, mean that the threat of grid instability is rising. This is especially true in relatively small synchronous grids such as Great Britain, compared to mainland Europe or the systems in North America. To fully characterize system oscillation events, it is important to be able to access all frequencies of possible oscillation modes. There are many approaches that use PMUs for oscillation detection and system stability protection, but ultimately waveform data is required to reach the full frequency range without attenuation, to diagnose and locate disturbances.
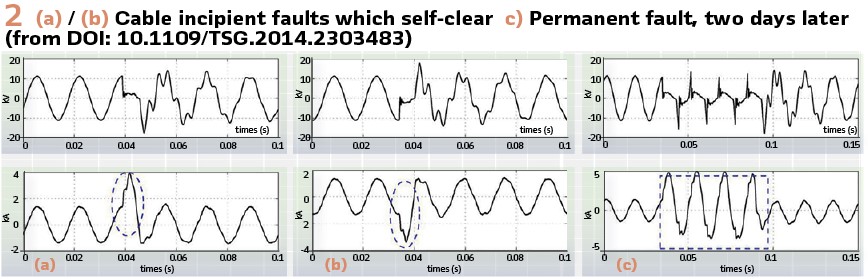
In general, low system strength can lead to certain voltage control oscillation modes. For example, in the Great Britain grid, oscillations contributed to a major outage in August 2019 which resulted in disconnecting supplies of 1 in 10 customers, in order to secure the wider transmission system. Later offline analysis revealed that there were warning signs visible 10 minutes before the event, including lightly-damped oscillation at 9 Hz, and 7.3 Hz oscillation visible in Scotland (approximately 200 miles away from the origin of the event) which was evidence of power electronic instability. However, real-time systems were not in place to react quickly to this (albeit rare and unpredictable) scenario, and synchrophasor monitoring systems, by design, cannot capture the full frequency range of all possible oscillation modes. PMU traces from a similar event in Scotland in July 2023 are shown in Figure 3.
To address these challenges, it is important to be able to detect oscillations in any frequency range in complex, converter-rich networks and provide intelligent and timely alarms for important system events. It may be necessary to identify oscillations at discrete locations, as well as combine information from multiple locations to perform wide-area pattern matching in real time. Such a solution should allow for some remedial action to be taken by the operator to mitigate the event. See later on an outline of the signal processing required to achieve this goal.
Downed conductor and wildfire detection: An important and promising application of synchronized waveforms is the automated detection and prevention of conditions which can lead to wildfires.
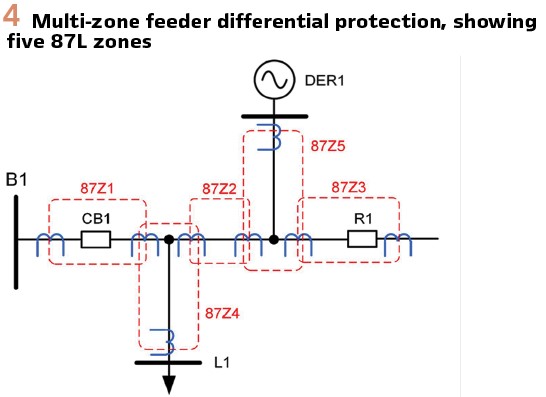
Automated techniques should be able to reliably detect precursors to wildfires, such as open conductor conditions due to a broken conductor and avoid maloperation for similar benign events such as unbalance or single-phase load disconnection. If a trip decision can be made within approximately 1 s, before a broken conductor is likely to fall to the ground, the risk of wildfire ignition from downed conductors can be significantly reduced. A solution involves using distributed passive sensing to enable multi-zone differential protection to provide the required protection speed and sensitivity, as illustrated in Figure 4. Even if fault current interrupting devices are not available on all sections, granular detection of the faulted section can greatly improve the response to wildfire risks.
There is also value in combining electrical signal analysis with additional context, such as the prevailing weather and circuit loading conditions, to dynamically adjust for scenarios where wildfires are more likely.
Existing Standards for Real-time Waveform Data Streaming
The main existing standard for streaming synchronized waveform data is the IEC 61850-9-2 Sampled Value (SV) Ethernet-based protocol, with some additional conventions for merging units defined in IEC 61869-9. SV was originally intended only for layer-2 Ethernet publishing within a local area network. IEC 61850-90-5 extended SV for transfer over an IP-based WAN, although it has been superseded by secure transmission of data using IEC 61850 Ed 2.1 and the IEC 62351 standards. SV typically requires high data bandwidth for streaming waveform samples, at approximately 5 Mbps for one stream containing four voltages, four currents, and quality information sampled at 4 kHz.
The Streaming Telemetry Transport Protocol (STTP) has been published as IEEE standard 2664-2024. Open-source reference implementations are available at https://github.com/sttp. STTP is intended to supersede IEEE C37.118.2 as the future protocol for transferring synchrophasor data, while providing flexibility for other streaming data purposes. STTP supports:
- Transferring waveform time-series data (as well as synchrophasors)
- High scalability
- Encryption using TLS
- Lossless data compression
Synchronized Waveform Deployment – Practical Factors
Data volume: Clearly, the use of waveform data has a disadvantage in terms of managing the high density of data, and the communications bandwidth required for streaming or bulk transfer of data between locations. The quantity of raw data which is generated and potentially transferred over a wide-area network (WAN) is much greater than typical synchrophasor or SCADA data streams. This issue needs to be addressed.
This inherent barrier means that system operators need to manage transmitting data over WANs and long-term storage, and therefore the benefits from new applications must outweigh the operational burden from deploying infrastructure to support synchronized waveform monitoring.
However, there are promising approaches for lossless, or near-lossless, compression of waveform data for streaming and storage, which can greatly reduce the burden on data communications and data archiving.
Some compression techniques can operate in real-time and, counter-intuitively, have the benefit of reducing overall latency.
This is because there is less data to transfer over the communications network resulting in greatly reduced transfer time, so any computation time for compression and decompression at the end points becomes negligible.
Real-time computation and communications infrastructure: To deliver a variety of real-time applications, suitable infrastructure for robust time synchronization, computation, and communications must be deployed. The infrastructure needs to be scalable in terms of the number of waveform measurement devices supported and the geographical area addressed.
A strategy for avoiding high bandwidth data transfers is to perform initial processing of waveform data streams locally within substations. Data only needs to leave the substation by exception, when local processing has characterized an event. Furthermore, processed outputs, such as phasors at targeted frequencies of interest, can be transferred instead of the raw waveform data – so therefore computation is inherently distributed over multiple substations.
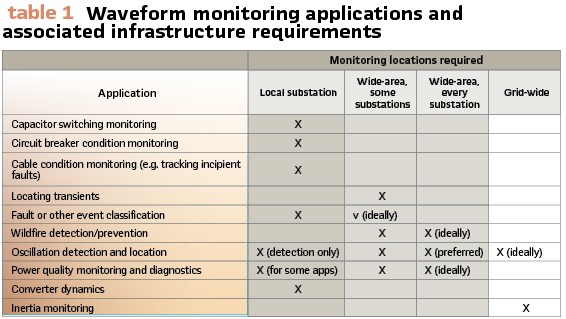
Table 1 proposes a suitable architecture for various waveform monitoring applications, using the following categories:
- Local substation: “edge” processing within the substation can perform the function, perhaps with non-real time reporting to a central location
- Wide-area, some substations: wide-area coordination is required, but sparse deployment of waveform monitoring devices is acceptable
- Wide-area, every substation: full deployment of waveform monitoring at every substation/node is required for optimal results
- Grid-wide: coordination of data over a large synchronous AC region is required
Table 1 illustrates that a lot of value can be delivered with local waveform-based computation within substations, involving minimal additional infrastructure. Expanding measurement locations across multiple substations further increases the opportunities, such as for locating transients and oscillations.
Offline analysis infrastructure: There are significant opportunities in speculative analysis and visualization of historical data, collected from system-wide sources. However, this requires infrastructure for data warehousing (for long-term storage of data) and computation (such as for training and testing machine learning models). It also requires expertise in data science and cybersecurity. Depending on the size of the network managed by a system operator, this could be achieved in multiple ways:
- Ad-hoc analysis campaigns with temporary deployment of monitoring equipment, perhaps partnering with third-party specialists for data analysis
- In-house data centers forming a private cloud, with dedicated teams for data analysis and cybersecurity. This requires maintaining significant resources and specialists
- Public, commercial cloud infrastructure. This approach does require some caution for securing connections from the utility’s systems to the cloud. However, being able to leverage existing, proven patterns and experts from the cloud provider can enable smaller utilities to avoid the need for employing specialist in-house teams to manage data engineering and cybersecurity. It therefore only requires a relatively low capex commitment and offers flexibility
Enhanced monitoring device design for the next generation of PMUs: Conventional PMUs algorithms are, by design, accurate under quasi-stationary conditions (near constant frequency during the algorithm processing window) and produce synchrophasors within a narrow band around the nominal frequency. PMUs and present standards therefore assume that fundamental phasors can accurately represent steady state and abnormal conditions within specified tolerances. Indeed, wide area monitoring enabled by PMUs have given insights into electromechanical oscillations, inter-area modes, and system frequency and recovery after system faults.
However, as IBRs become more prevalent, dynamics associated with switching power electronics and inverter controls can introduce conditions that are outside of the design specifications of existing PMUs. This limits the capability of conventional synchrophasors for understanding and mitigating such phenomena.
Advances in data analytics require labelled datasets consisting of distinguishable features of (often sub-cycle) events that may be filtered out by PMUs. To address these limitations, the next generation of PMUs should move beyond fundamental phasors and seek to accurately represent the information contained in the underlying synchronised waveforms.
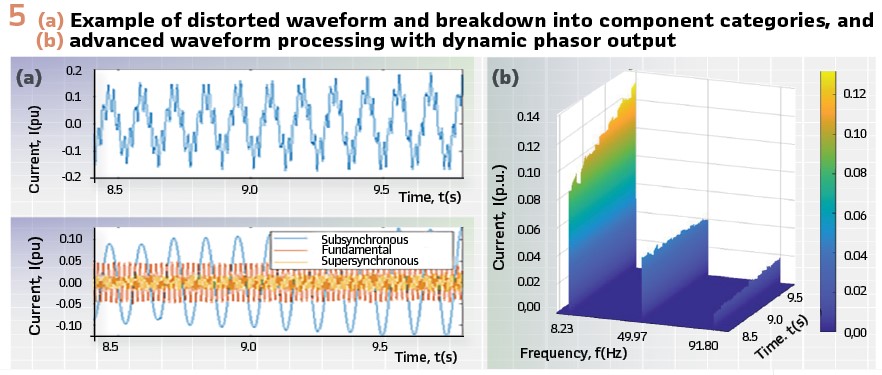
To achieve this, an adaptive wavelet based synchronised waveform processing algorithm can offer a promising solution. Transient conditions which manifest as (non-sinusoidal) distortions in the waveform can be detected, localized, and sparsely represented in the time-frequency domain based on wavelet coefficients across different frequency bands. The shape of the distortions can result in different time-frequency features that may be unique to the underlying event cause and can be used as inputs to pattern matching algorithms.

To detect multi-modal components including the nominal frequency as well harmonics or inter-harmonic oscillations, adaptive filtering provided by the Empirical Wavelet Transform (EWT) can be utilized. The EWT defines the wavelet bandpass filters based on peaks in the frequency spectrum of the signal. This filters the signal into the nominal and, where applicable, oscillation components. Standard phasor extraction techniques can then be applied to each component to derive multiple phasors at the frequencies of interest.
The overall approach produces fundamental phasors during steady state and, via the flexibility of the wavelet bases, adapts to abnormal conditions, thus producing outputs that accurately represent the underlying dynamics present in the raw waveforms. Processed outputs (time-frequency features, multi-frequency phasors) can be streamed or stored with significantly less overhead than raw synchronized waveforms.
Enhanced PMU algorithms can therefore detect and characterize interesting portions of waveforms, driving new insights into emerging phenomena and enabling new wide-area and data analytic solutions.
An example of this technique applied to a complex oscillation event is given in Figure 5.
Data accuracy: Analysis methods using measurement data need to appropriately handle data quality issues, such as loss of global time synchronization, CT saturation, and missing data. For example, loss and restoration of time sync can lead to drifting and overlapping timestamps. It is recommended that data quality and time synchronization information is preserved within the end-to-end process of acquisition at the sensor to the final long-term data storage solution. Analysis campaigns must also ensure that the data quality information is inspected, so that conclusions from the investigation can be trusted. However, this inevitably adds complexity to the analysis pipeline.
Conclusions
While some substation devices such as protection relays, merging units, and PMUs already process waveform data internally, there are many new opportunities for widespread analysis of waveforms for enhancing grid operations. This article has reviewed several examples of emerging waveform analysis techniques which enable applications such as incipient fault detection, oscillation location, and advanced power quality analysis.
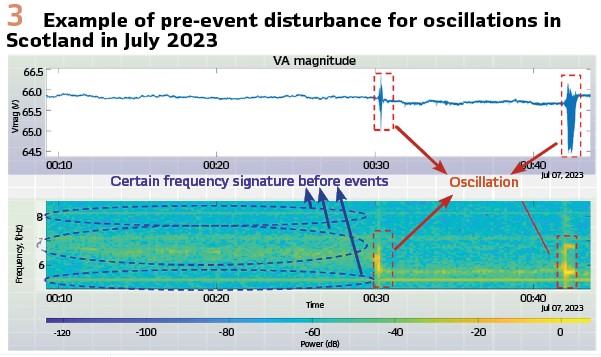
Guidelines for the practical deployment of several real-time waveform monitoring applications have been proposed, in terms of the required computation and communications infrastructure. This includes requirements and options for real-time and offline analysis applications, which could help automate future grid protection and control solutions.
Biographies:

Steven Blair is VP Applications at Synaptec, where leads Synaptec’s software and data analytics strategy. He holds a PhD in Electronic & Electrical Engineering and an MEng in Computer & Electronic Systems from the University of Strathclyde. He has been both a researcher and academic at the University of Strathclyde, including holding the Nokia lectureship position. He is interested in power system protection, power quality, real-time systems, and communications technologies. Dr Blair is presently a member of CIGRE JWG C4/C2.62 and IEC TC57 WG10.

Kevin Kawal received his BSc in Electrical Engineering from The University of the West Indies in 2013 and an MSc in Electrical Power and Energy Systems from the University of Strathclyde, Glasgow, UK, in 2020. He is currently working towards a PhD degree in Electronic and Electrical Engineering at the University of Strathclyde, Glasgow, UK. His research focuses on power system monitoring and the application of data analytics to synchronized power system measurements. His broader interests include developing measurement-based solutions to enhance power system reliability and security.

Qiteng Kong is a Reader at the University of Strathclyde. He received his BEng (Hons) degree as the top graduate of the year in 2011 and PhD in 2015, both from Strathclyde. His main research area is on monitoring, protection and control of future power systems dominated by renewable energy sources. He has 100+ publications in international journals and conferences, along with 3 book chapters. Dr Hong is a Member of CIGRE WG (WG) B5.50, IEEE WG P2004, an IEEE Task Force on cloud-based control, and the IET DPSP Technical Committee.